Analysis of the Market Size and Growth Potential of the EPE Foam Packaging Industry
Analysis of the Market Size and Growth Potential of the EPE Foam Packaging Industry
Introduction: An Underestimated Market Worth Billions
The EPE foam packaging industry is undergoing a profound transformation. From electronics to cold chain logistics, and from traditional manufacturing to emerging e-commerce, this white foam material is reshaping the global packaging landscape with its exceptional performance and environmental advantages. This article will reveal the industry's true scale and growth potential based on the latest market data.
Chapter 1: Global Market Size and Regional Landscape of EPE Foam
1.1 Analysis of Global EPE Foam Market Volume
According to the latest Grand View Research report, the global EPE foam packaging market reached $28.6 billion (approximately RMB 205 billion) in 2023. This figure reflects a sustained growth trajectory: the compound annual growth rate (CAGR) from 2018 to 2023 hit 7.8%, significantly outpacing the packaging industry's overall growth rate of 4.5%.
Key Growth Drivers of EPE Foam:
Demand for electronics packaging: Contributing 38% growth
E-commerce logistics packaging upgrades: Contributing 29% growth
Environmental sustainability demand: Contributing 22% growth
Emerging application sectors: Contributing 11% growth
1.2 Regional Market Landscape: China Emerges as Global Hub
Asia-Pacific Region: The world's largest market, accounting for 47%
China dominates 65% of the Asia-Pacific market, with a 2023 market size of approximately RMB 68 billion
Annual growth rate of 9.2%, exceeding the global average
Industrial concentration: Yangtze River Delta (45%), Pearl River Delta (35%), Bohai Rim (15%)
European Market: Mature yet steadily growing, accounting for 28%
Germany, Italy, and France collectively hold 60% of the European market
Growth rate of 5.5%, primarily driven by environmental regulations
North American market: Technology innovation-led, accounting for 21%
U.S. market constitutes 90% of North America
Growth rate of 6.8%, with high proportion in high-end application sectors
Other regions: Emerging markets rapidly rising, accounting for 4%
India, Southeast Asia, and Middle East markets show growth rates of 12-15%
Small base but immense potential
Chapter 2: In-Depth Analysis of China's EPE Foam Market
2.1 Current State of China's EPE Foam Packaging Market
EPE Foam Scale Data (2023):
Total Output Value: 68 billion yuan
Number of Manufacturers: Approximately 3,200 (including 480 enterprises above designated size)
Annual Total Output: Approximately 4.2 million tons
Employees: Approximately 280,000
Characteristics of EPE Foam Industry Structure:
Pronounced Pyramid Structure
Large Enterprises (Annual Output Value > RMB 500 million): Approximately 15 companies, accounting for 30% of the market
Medium-sized Enterprises (RMB 50 million - 500 million): Approximately 450 companies, accounting for 45%
Small Enterprises (< RMB 50 million): Approximately 2,735 companies, accounting for 25%
Prominent regional clustering effects
Zhejiang Taizhou cluster: Nation's largest, accounting for 25% of output
Guangdong Dongguan cluster: Most technologically advanced, producing 60% of high-end products
Jiangsu Suzhou cluster: Concentration of foreign-funded enterprises, export-oriented
Hebei Xiong'an cluster: Northern China's largest, serving Beijing-Tianjin-Hebei region
2.2 EPE Foam Demand-Side Analysis: Who is purchasing EPE foam?
By industry segmentation (2023 data):
Industry Sectors | Market Size (in billions of yuan) | proportion | growth rate | Features |
|---|---|---|---|---|
electronic products | 190 | 28% | 10.5% | High requirements for anti-static properties and high resilience |
Home Appliances | 125 | 18% | 7.2% | Striving for a balance between cost and efficiency |
Medical Devices | 85 | 13% | 15.3% | Strict requirements for sterility and shock resistance |
Automotive components | 75 | 11% | 8.6% | High demand for heavy-duty and irregularly shaped components |
E-commerce Logistics | 95 | 14% | 22.4% | Explosive growth, lightweight trend |
Food Cold Chain | 55 | 8% | 18.7% | Insulation and moisture resistance are key. |
Other fields | 55 | 8% | 9.1% | Furniture, handicrafts, industrial goods |
EPE Foam Customer Size Structure:
Large Enterprise Customers (Annual Purchases > 10 million): 15%, but contribute 45% of order volume
Medium-sized Enterprise Customers (1-10 million): 35%, contribute 40% of order volume
Small and Micro Enterprise Customers (< 1 million): 50%, contribute only 15% of order volume
Chapter 3: EPE Foam Growth Drivers Analysis
3.1 Primary Growth Driver: E-commerce Packaging Revolution
Trends Behind the Numbers:
China's express delivery volume reached 132 billion parcels in 2023, with approximately 40% requiring cushioning packaging. Traditional bubble wrap and EPS are rapidly being replaced by EPE foam:
Replacement Rate Progress:
Electronics Delivery: EPE foam share reached 65% (2020: 35%)
Home Appliance Delivery: EPE foam share 42% (2020: 18%)
Fresh Cold-Chain Delivery: EPE foam share 28% (2020: 8%)
E-commerce Platform Policy Drives:
JD.com's “Green Stream Initiative”: Requires 80% EPE foam usage by 2025
Tmall's “Green Packaging”: Traffic prioritization for products using EPE foam packaging
Pinduoduo's “Eco-Packaging Subsidy”: 0.1-0.3 yuan subsidy per order
3.2 EPE Foam's Second Driving Force: Environmental Policy Pressure
Global Environmental Regulation Timeline:
EU: Comprehensive restrictions on single-use plastics by 2025, excluding EPE foam (provided recyclability standards are met)
China: 14th Five-Year Plan Plastic Pollution Control Action Plan: 50% phase-out of EPS express packaging by 2025
U.S.: California, New York, and other states have enacted laws restricting EPS food packaging
Corporate Social Responsibility Pressure:
Apple: Requires 100% EPE foam usage in supply chain
Huawei: 100% recyclable packaging materials by 2025, with EPE foam as the preferred choice
Haier: EPE foam usage ratio increased from 30% in 2020 to 70% by 2023
3.3 EPE Foam Third Driving Force: Technological Advancement and Cost Optimization
Cost Trend Comparison Between EPE Foam and Traditional Materials:
Material Type | 2020 Cost Index | 2023 Cost Index | Reasons for the change |
|---|---|---|---|
| epe foam(25kg/m³) | 100 | 95 | Mass production, mature technology |
| EPS(20kg/m³) | 85 | 105 | Environmental Protection Tax, Raw Material Price Fluctuations |
Corrugated Paper (Reinforced) | 90 | 115 | Rise in base paper prices |
Bubble wrap | 110 | 130 | Transmission of Rising Oil Prices |
Cost reductions driven by technological breakthroughs:
Blowing agent recovery technology: Reduces raw material costs by 8-12%
High-speed production lines: Labor cost ratio decreases from 15% to 8%
Precise thickness control: Material utilization rate increases from 88% to 95%
Chapter 4: Growth Potential in EPE Foam Submarkets
4.1 Forecast for High-Growth Submarkets
Medical Device Packaging (2024-2028 CAGR projected at 18.2%)
Drivers: Aging population, upgrading medical consumption, import substitution for high-end equipment
Market Size Forecast: RMB 20 billion by 2028
Technical Requirements: Sterile workshop production, traceability, high customization
New Energy Vehicle Component Packaging (Projected CAGR: 16.5%)
Drivers: Rising penetration of new energy vehicles, increased component value
Special Requirements: Battery pack-specific EPE foam (fireproof, shockproof, lightweight)
Per-vehicle value: Traditional vehicles: ¥50-80; New energy vehicles: ¥150-300
Fresh E-commerce Cold Chain Packaging (CAGR projected at 22.3%)
Drivers: Explosive growth in pre-cooked meals, improved cold chain infrastructure
Technical direction: EPE foam + phase change material composite technology
Market size: ¥5.5 billion in 2023 → ¥15 billion in 2028
4.2 Exploring Emerging Applications for EPE Foam
Building Insulation Sector:
Market Potential: China constructs approximately 2 billion square meters of new buildings annually
EPE Foam Advantages: Lightweight, fire-resistant, easy to install
Projected Scale: Could reach 5 billion yuan within 5 years
Sports Protective Gear:
Sports protective equipment, helmet liners, fitness equipment packaging
Demand Characteristics: High resilience, sweat resistance, lightweight
Projected Scale: ¥2 billion within 3 years
Chapter 5: Profit Distribution Analysis of the EPE Foam Industry Chain
5.1 Profit Analysis Across Value Chain Segments
Profit Distribution in the EPE Foam Packaging Industry Chain (2023):
segment | Gross Profit Margin | Net Profit Margin | Key Success Factors |
|---|---|---|---|
Production of raw material (LDPE) | 12-18% | 5-8% | Scale, Refining and Petrochemical Integration |
| epe foam Roll Stock Production | 15-25% | 8-12% | Equipment Efficiency, Process Control |
Deep Processing (Cutting/Laminating) | 20-30% | 10-15% | Design Capabilities, Client Relationships |
End-of-Line Packaging Solutions | 25-35% | 12-18% | Overall Design, Supply Chain Management |
Key Findings:
Profit margins increase with proximity to end customers.
Net profit margins for simple roll stock production range from 8-12%,
while providing complete packaging solutions can achieve 15-20%.
5.2 Return on Investment Analysis
ROI Comparison Across Enterprise Sizes:
Investment scale | Investment Amount (Ten Thousand Yuan) | Annual Profit (Ten Thousand Yuan) | ROI | Payback Period (Years) |
|---|---|---|---|---|
Small workshop | 50-100 | 15-30 | 25-35% | 2.5-3.5 |
Medium-sized production plant | 300-500 | 80-150 | 25-30% | 3-4 |
Large-scale integrated plant | 1000-2000 | 250-500 | 20-25% | 4-5 |
Solution Provider | 200-400 | 60-120 | 25-35% | 2.5-3.5 |
Key Insight: Small specialized enterprises and solution providers deliver the highest ROI and optimal capital efficiency.
Chapter 6: EPE Foam Market Size Forecast for the Next Five Years
6.1 Overall Market Size Forecast
Based on linear regression and industry research, we project the following market trends for 2024-2028:
Year | Global Market Size (in billions of U.S. dollars) | China Market (RMB billion) | China's growth rate |
|---|---|---|---|
| 2024 | 308 | 740 | 8.8% |
| 2025 | 332 | 805 | 8.8% |
| 2026 | 358 | 875 | 8.7% |
| 2027 | 386 | 950 | 8.6% |
| 2028 | 416 | 1030 | 8.4% |
Key Data Forecast for 2028:
China Market Exceeds 100 Billion: 103 billion yuan
Global Share: China's share of the global market rises from 32% in 2023 to 35%
Number of Enterprises: Enterprises above designated size increase from 480 to 600
Number of Employees: Increases from 280,000 to 350,000
6.2 Projected Structural Shifts
Product Mix Evolution:
Standard Roll Materials Share: Decreases from 65% to 50%
Value-Added Processed Products Share: Increases from 25% to 35%
Functional EPE Foam Share: Increases from 10% to 15%
Customer Structure Transformation:
Strategic Procurement by Major Clients Share: Increases from 45% to 55%
E-commerce platform collective procurement share: From 5% to 15%
Long-tail micro/small customer share: From 50% to 30%
Chapter 7: EPE Foam Entry Barriers and Opportunity Windows
7.1 Current Industry Entry Barriers
Capital Barriers:
Small processing workshops: ¥500,000–1,000,000
Medium-scale production lines: ¥3-5 million
Large modern factories: ¥10 million+
Technical Barriers:
Process formulations: Requires 6-12 months of experience accumulation
Equipment operation: Skilled technicians are scarce
Quality stability: Requires a comprehensive quality control system
Customer Barriers:
Certification Cycle: 3-6 months for large-client factory audits
Trust Building: Requires accumulation of successful case studies
Payment Term Pressure: Major clients typically demand 60-90 day payment terms
7.2 Opportunity Window for New Entrants
Three Optimal Entry Points:
Regional Niche Market Gaps
Central/Western regions penetration rate only 1/3 of Eastern China
Shortage of specialized suppliers in tier-3/4 cities
Opportunity: Become regional leader
Vertical Industry Specialization
Medical device packaging: High barriers, high margins
New energy vehicle parts packaging: Early-stage market
Opportunity: Deepen expertise in one industry to build specialized barriers
Innovative Business Models
Packaging as a Service (PaaS): Leasing replaces sales
Shared factories: Equipment pooling to lower investment thresholds
Digital packaging design: Software + material integration
Chapter 8: Risk Warnings and Mitigation Strategies
8.1 Key Risk Factors
Raw material price volatility risk:
LDPE prices highly correlated with oil
2023 price fluctuations reached ±25%
Response: Establish long-term agreements with suppliers, maintain appropriate inventory levels
Risk of Intensified Environmental Policies:
Potential introduction of stricter recyclability requirements
Potential increase in carbon emission costs
Response: Proactively deploy environmental technologies, pursue green certifications
Risk of Overcapacity:
Price wars have emerged in low-end markets
Capacity utilization rates below 70% in some regions
Response: Differentiate positioning to avoid homogeneous competition
8.2 Summary of Successful Enterprise Characteristics
Analysis of the industry's top 50 enterprises reveals that successful companies generally possess:
Technical depth: In-house process improvement capabilities
Customer stickiness: Providing holistic solutions rather than merely selling materials
Cost control: Precision management, with costs 8-12% below industry average
Rapid Response: Capability for small-batch production and fast delivery
Environmental Leadership: Proactive adoption of recyclable and bio-based technologies
Conclusion: Cautiously Optimistic, Differentiation Wins
The EPE foam packaging industry is indeed in a golden development period, but the era of “unrestrained growth” has passed. The market exhibits the following characteristics:
Sustained volume growth with slowing acceleration: Transitioning from high-speed growth (>10%) to medium-high growth (8-9%)
Notable structural upgrade: Shifting from “availability” to “quality,” with rapid growth in premium demand
Redefined competitive landscape: Moving from price competition to integrated competition in technology, service, and solutions
For new entrants, it is advisable to avoid the saturated market for standard roll materials and instead focus on:
Regional Untapped Markets
Vertical Specialized Fields
Innovative Business Models
High-End Functional Materials
For existing enterprises, it is imperative to:
Accelerate technological upgrades to enhance added value
Deepen client collaborations to deliver comprehensive solutions
Control costs without engaging in price wars
Monitor environmental trends and proactively position for future demands
The trillion-dollar market for EPE foam packaging is opening up, yet opportunities will only favor those who deliver unique value and build core competitive barriers. In this industry of relentless technological advancement and evolving demands, innovators and specialists will shape the future.
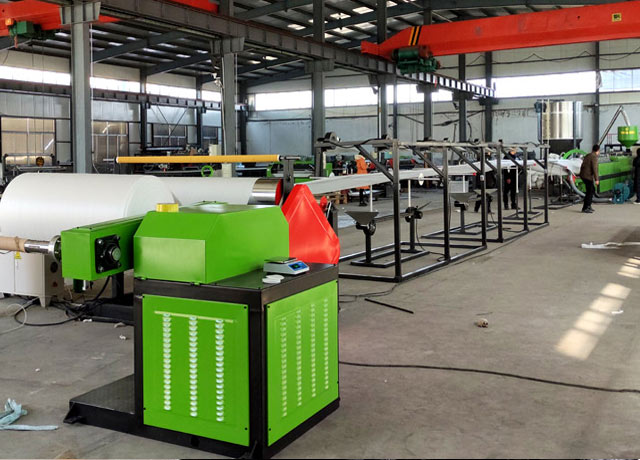
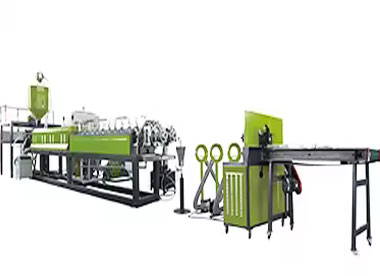
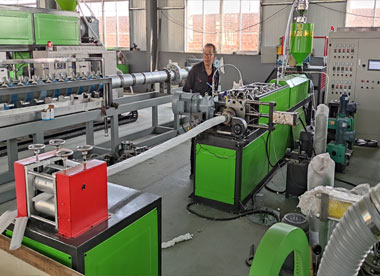
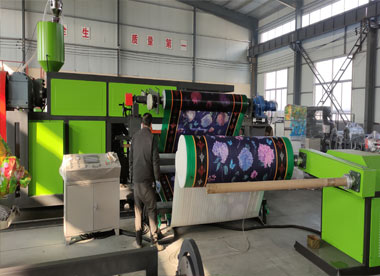
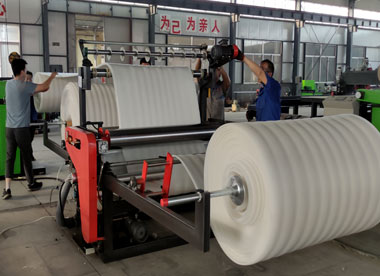
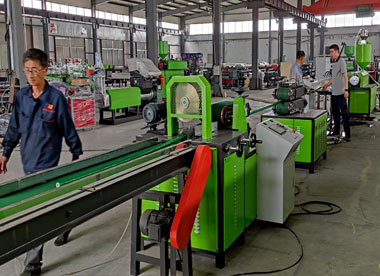
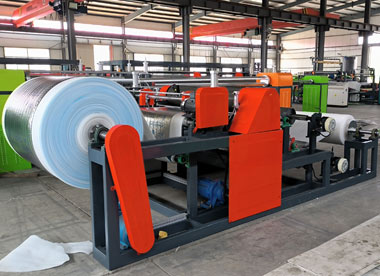
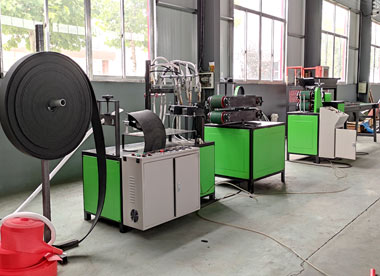
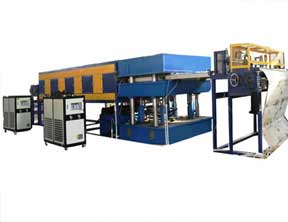
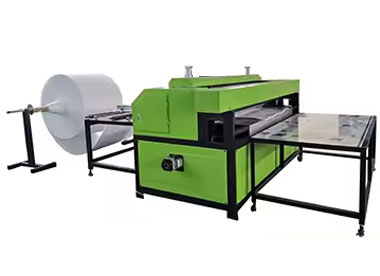
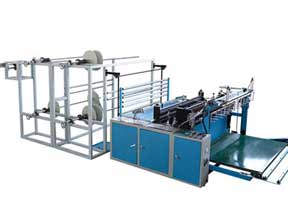
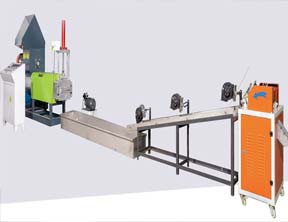
Why Choose Us
China manufacturer of EPE foam machinery since 2003.EPE foam machine not only have covered all over China, but also have exported to more than 70 countries
Would you like to take a closer look at our offer?

You May Like:
We are making Analysis of the Market Size and Growth Potential of the EPE Foam Packaging Industry factory, manufacturer & supplier & exporter.We specialize in making EPE foam machine for over 20+ years