In-Depth Analysis of EPE Foam Physical Properties: A Complete Guide from Testing Data to Quality Ass
In-Depth Analysis of EPE Foam Physical Properties: A Complete Guide from Testing Data to Quality Assessment
Introduction: Why Focus on Physical Properties? During EPE foam procurement and production, physical property metrics serve as the sole scientific basis for judging material quality. These indicators directly determine whether EPE foam can effectively protect your products, deliver cost-effectiveness, and meet specific application requirements. This article provides a comprehensive EPE foam quality evaluation system to help you uncover the truth about quality through data.
Chapter 1: Density—The First Threshold of EPE Foam Quality
1.1 The Fundamental Significance of Density
Density represents the mass per unit volume of EPE foam (kg/m³). It directly correlates with the following properties:
- Cushioning Performance: A 20% increase in density boosts compressive strength by 40-50%
- Material Cost: Each 1 kg/m³ increase in density raises raw material costs by approximately 4-5%
- Product weight: Directly impacts transportation costs
1.2 Scientific Methods for Density Measurement
**Standard Measurement Procedure (per GB/T 6343):**
1. **Sample Preparation**: Cut a flat specimen of at least 100mm × 100mm, maintaining original thickness
2. **Dimension Measurement**: Use a vernier caliper to measure three points each for length, width, and thickness, then calculate the average
3. **Mass Measurement**: Weigh using a balance accurate to 0.01g
4. **Density Calculation**: Density = Mass / Volume
**Industry Actual Data Range:**
- **Low-Density Grade**: 18-22 kg/m³ (for lightweight packaging, fillers)
- **Standard Grade**: 23-27 kg/m³ (Mainstream choice for electronics and appliance packaging)
- **High-Density Grade**: 28-35 kg/m³ (Heavy equipment, precision instruments)
- **Special Grade**: 36-45 kg/m³ (Specialized protection, building insulation)
1.3 Density Uniformity—A Hidden Quality Indicator
Density deviation for premium EPE foam should be controlled within:
- **Longitudinal Deviation**: ≤±0.5 kg/m³ (extrusion direction)
- **Transverse Deviation**: ≤±1.0 kg/m³ (width direction)
- **Batch Stability**: Different batches of the same specification ≤±1.5 kg/m³
**Field Simplified Testing Method:**
Take samples from the head, middle, and tail sections of the same roll of EPE foam. Cut each sample to the same dimensions (e.g., 10cm × 10cm × 5cm) and weigh them separately. If the maximum weight difference exceeds 5%, the density uniformity is considered non-compliant.
Chapter 2: Rebound Rate and Permanent Compression Set—The Core of Cushioning Performance
2.1 Engineering Definition of Rebound Rate
Rebound rate reflects EPE foam's ability to recover its original thickness after compression. Calculation formula:
Rebound Rate (%) = (H₂/H₁) × 100%
Where H₁ is the original thickness and H₂ is the thickness after unloading.
2.2 Standard Test Method (GB/T 8168)
**Test Conditions:**
- Compression: 50% of initial thickness
- Compression Duration: 24 hours
- Recovery Time After Unloading: 30 minutes
- Test Temperature: 23±2°C (standard environment)
**Industry Acceptance Criteria:**
- **Grade A**: Resilience ≥95%
- **Grade B**: Rebound rate 90-95%
- **Grade C**: Rebound rate 85-90%
- **Non-conforming**: Rebound rate <85%
2.3 Permanent Compression Set
This stricter metric measures thickness loss after 72 hours of compression:
Permanent Deformation Rate (%) = [(H₁ - H₃)/H₁] × 100%
Where H₃ is the thickness after 72 hours of compression and 30 minutes of recovery.
**Quality Grading Standards:**
- Electronics Packaging Grade: <3%
- Home Appliance Packaging Grade: 3-5%
- General Packaging Grade: 5-8%
- Non-compliant: >8%
2.4 Rapid Evaluation Method: Palm Pressure Test
1. Take a 50mm-thick sample and press firmly to approximately 25mm
2. Hold for 5 seconds before releasing
3. Measure thickness with calipers after 10 seconds
4. Calculate: Recovery thickness / Original thickness × 100%
Though not precise, this method quickly screens out substandard products (those with significantly insufficient rebound should be discarded immediately).
Chapter 3: Compressive Strength and Hardness—Quantifying Load-Bearing Capacity
3.1 Compressive Strength Test (25% Compression)
This is the most practical load-bearing indicator, reflecting EPE foam's support capability under light pressure.
**Test Standard (GB/T 8813):**
- Compression speed: 10 mm/min
- Compress to 25% of original thickness
- Record pressure value (kPa) at this point
**Industry Reference Data Table:**
Density (kg/m³) | Compressive strength (kPa) | Applicable Product Weight Range |
|---|---|---|
| 20 | 35-45 | <5kg |
| 25 | 55-70 | 5-15kg |
| 30 | 85-105 | 15-30kg |
| 35 | 120-145 | 30-50kg |
| 40 | 160-190 | >50kg |
3.2 Hardness (Indentation Hardness Index)
Measured using the indentation method, reflecting the material's surface resistance to puncture.
**Testing Specifications:**
- Indenter diameter: Φ25.4mm
- Indentation depth: 40% of total thickness
- Holding time: 30 seconds
**Quality Assessment:**
High-quality EPE foam exhibits uniform hardness, with hardness deviation ≤15% across different points on the same plane.
3.3 Compression Stress-Strain Curve Analysis
This serves as the gold standard for evaluating EPE foam's cushioning performance.
**Ideal Curve Characteristics:**
Stage 1 (0-10% compression): Linear elastic region with gentle slope
Stage 2 (10-50% compression): Plateau zone with slow stress increase
Stage 3 (50-70% compression): Densification zone with steep stress rise
**Characteristics of Substandard Material Curves:**
- No distinct plateau zone
- Excessively steep initial slope (material is too rigid)
- Significant deviation between unloading and loading curves (high energy dissipation)
Chapter 4: Tensile Strength and Elongation—Dual Guarantees of Material Toughness
4.1 Tensile Strength Testing (GB/T 6344)
**Specimen Dimensions:** Dumbbell-shaped specimen, gauge length 50mm, width 10mm
**Tensile Speed:** 500mm/min
**Reference Acceptance Criteria:**
Density Grade | Tensile strength (MPa) | Elongation (%) |
|---|---|---|
low density (20kg/m³) | ≥0.12 | ≥120 |
Medium Density (25kg/m³) | ≥0.18 | ≥150 |
High density (30kg/m³) | ≥0.25 | ≥180 |
4.2 Tear Strength—A More Practical Performance Indicator
**Right-Angle Tear Test (GB/T 10808):**
- Specimen Size: 100mm × 50mm
- Notch Length: 50mm
- Test Speed: 250mm/min
**Quality Assessment:**
- Premium Grade: Smooth tearing process with stable tear force
- Poor Quality: Abrupt breakage or significant fluctuations in tear force
4.3 Comprehensive Toughness Evaluation
Toughness = Tensile Strength × Elongation
- High Toughness: >30 MPa·% (Suitable for reusable packaging)
- Medium Toughness: 20–30 MPa·% (Standard packaging)
- Low toughness: <20 MPa·% (single-use packaging)
Chapter 5: Cell Structure—A Window into Micro-Quality
5.1 Cell Size and Distribution
**Microscope Observation Standard (100x magnification):**
- **Grade A**: Cell diameter 0.2–0.5 mm, uniform distribution, closed-cell rate >95%
- **Grade B**: Bubble diameter 0.5–1.0 mm, relatively uniform distribution, closed-cell rate 90–95%
- **Grade C**: Variable bubble size (0.2–1.5 mm), open-cell structure present
**Data on the Impact of Bubble Structure on Performance:**
Pore characteristics | Effect on density | Impact on the bounce rate | Effect on thermal insulation |
|---|---|---|---|
Fine and uniform bubbles | +5-10% | +3-5% | +15-20% |
Large pores | -5-10% | -5-10% | -20-30% |
Open-hole structure | -10-15% | -20-30% | -50%以上 |
5.2 Bubble Wall Thickness Uniformity
Bubble wall thickness can be measured using scanning electron microscopy (SEM):
- Premium grade: Uniform wall thickness, 0.01–0.03 mm
- Standard grade: Uneven wall thickness, 0.005–0.05 mm
- Substandard grade: Punctures present, extreme variations in wall thickness
5.3 Simplified Assessment Method: Tear Surface Inspection
Tear open EPE foam and examine the tear surface:
- Premium: Uniform cells exhibiting a regular “honeycomb” structure
- Average: Most cells intact but with minor deformation
- Substandard: Broken cells, visible open pores, and “stringing” effects
Chapter 6: Environmental Adaptability—Performance Retention Under Extreme Conditions
6.1 Temperature Stability Testing
**High-Low Temperature Cycling Test (-40°C to +80°C):**
1. Maintain at -40℃ for 24 hours; test rebound rate and hardness
2. Recover at room temperature for 2 hours
3. Maintain at +80℃ for 24 hours; retest
4. Calculate performance change rate
**Acceptance Criteria:**
- Rebound rate change: ≤±5%
- Hardness change: ≤±10%
- Dimensional change: ≤±1%
6.2 Humidity and Heat Aging Test
Conditions: Temperature 60°C, Humidity 95% RH, Duration 72 hours
**Performance Retention Requirements:**
- Tensile strength retention: ≥80%
- Resilience retention: ≥85%
- No significant discoloration or tackiness
6.3 Chemical Resistance Test
**Immersion Test (24 hours):**
Reagent | Qualification Standard (Quality Variation Rate) | Application Scenarios |
|---|---|---|
| 10% NaCl溶液 | ≤±1% | Marine Packaging |
| 10% H₂SO₄溶液 | ≤±2% | Industrial environment |
Motor oil | ≤±3% | Automotive components |
tap water | ≤±0.5% | General Packaging |
Chapter 7: Functional Specifications—Quality Requirements for Special Applications
7.1 Anti-Static Performance
**Surface Resistance Test (GB/T 1410):**
- **Anti-Static Grade**: 10⁶–10⁹ Ω
- **Conductive Grade**: 10³–10⁶ Ω
- **Standard Grade**: >10⁹ Ω
**Charge Decay Test:**
Time to decay to 10% after 5000V charge:
- Class A: <2.0 seconds
- Class B: 2.0–4.0 seconds
- Class C: >4.0 seconds
7.2 Flame Retardancy (UL94 Standard)
**Test Method:**
- Specimen Dimensions: 125mm × 13mm × Thickness
- Flame height: 20mm
- Two ignitions, each lasting 10 seconds
**Classification:**
- **HF-1 Class**: Self-extinguishes upon flame removal, no dripping
- **HF-2 Class**: Self-extinguishes upon flame removal, with dripping
- **HBF Class**: Burning rate <40mm/min
- **No Rating**: Sustained burning
7.3 Thermal Insulation Performance (Thermal Conductivity)
**Test Standard:** GB/T 10294
**Industry Data Range:**
- Low-density EPE foam (20 kg/m³): 0.038–0.040 W/(m·K)
- Medium-density EPE foam (25 kg/m³): 0.040–0.042 W/(m·K)
- High-density EPE foam (30 kg/m³): 0.042–0.045 W/(m·K)
Chapter 8: Sensory Indicators—Practical Techniques for Rapid Assessment
8.1 Visual Inspection Checklist
1. **Color Uniformity**: Consistent color across the entire roll, no color variation stripes
2. **Surface Flatness**: No noticeable bumps, wrinkles, or unevenness
3. **Edge Neatness**: Straight cut edges, no frayed or rough edges
4. **Impurity Check**: No black spots or foreign particles
8.2 Tactile and Textural Assessment
**Characteristics of Premium EPE Foam:**
- **Handfeel**: Soft yet resilient, with rapid rebound after compression
- **Surface Texture**: Smooth and refined, without roughness
- **Bending Test**: Folds 180° without breaking or white marks
- **Tear Resistance**: Requires significant force to tear, produces a dull tearing sound
8.3 Odor Assessment
- **Normal Odor**: Very faint polyethylene scent (similar to new plastic products)
- **Abnormal Odors**:
- Pungent chemical odor: Possible residual foaming agents or inferior raw materials
- Burnt smell: Improper production temperature control
- Sour odor: Contaminated or degraded raw materials
Chapter 9: Comprehensive Quality Evaluation System
9.1 Rapid Quality Scoring Sheet
(Maximum 10 points per item, total 100 points)
Evaluation Project | Test Method | Weight | Grading Criteria |
|---|---|---|---|
Density uniformity | Three-Point Weighing Method | 15% | Deviation<3%:10分;3-5%:7分;>5%:4分 |
Bounce rate | 50% Compression 24h | 20% | >95%:10分;90-95%:8分;<90%:5分 |
Tensile Properties | Tensile test | 15% | Intensity >0.2MPaAnd stretch out >150%:10分 |
Pore structure | Tear surface observation | 15% | Uniform closed-cell:10; Generally uniform:7; Uneven:4 |
Environmental Stability | High and Low Temperature Testing | 15% | Performance Changes<5%:10;5-10%:7;>10%:4 |
Sensory indicators | Appearance and feel | 10% | Four A's:10; Three Excellence Awards :8 |
Special Features | Testing on demand | 10% | Meet the requirements :10; basically meets:7 |
**Quality Grade Classification:**
- **Premium Grade**: ≥85 points (Suitable for precision instruments and high-value products)
- **Qualified Grade**: 70-84 points (Meets most packaging requirements)
- **Serviceable Grade**: 60-69 points (Low-value products or short-term use)
- **Non-conforming Grade**: <60 points (Not recommended for use)
9.2 Key Requirements for Different Applications
**Electronic Product Packaging:**
- Anti-static Performance: Must meet standards
- Resilience: >93%
- Permanent Deformation: <3%
- Cleanliness: Dust-free, free of impurities
**Home Appliance Packaging:**
- Compressive strength: >80 kPa (at 25 kg/m³ density)
- Cost control: Minor reductions in non-critical metrics permitted
- Batch consistency: Minimal variation between production runs
**Cold Chain Packaging:**
- Thermal conductivity: <0.040 W/(m·K)
- Moisture resistance: Water absorption <0.01 g/cm²
- Temperature Stability: Performance stable between -40°C and +80°C
9.3 Five Key Metrics for Supplier Evaluation
1. **Density Deviation Control**: Monthly production data; deviation <±1.5 kg/m³
2. **Resilience Rate Stability**: Continuous testing across 10 batches; fluctuation <±2%
3. **Cell Structure Qualification Rate**: Microscope sampling inspection, closed-cell rate >92%
4. **Environmental Test Pass Rate**: Quarterly sampling inspection, 100% pass rate for basic tests
5. **Customer Complaint Rate**: <0.5% (calculated per batch)
Chapter 10: Root Causes of Common Quality Issues
10.1 Three Primary Causes of Insufficient Rebound
1. **Raw Material Issues**: Inappropriate LDPE melt index (should be controlled at 2-4g/10min)
2. **Foaming Process**: Improper foaming agent ratio or uneven mixing
3. **Inadequate Post-Processing**: Excessive winding tension causing cell flattening
10.2 Technical Roots of Density Non-Uniformity
- **Longitudinal Variation**: Extruder temperature fluctuations or screw wear
- **Transverse Variation**: Mold design or improper adjustment
- **Batch-to-Batch Variation**: Raw material batch changes or process parameter drift
10.3 Process Solutions for Cell Structure Defects
- **Excessively Large Cells**: Excessive blowing agent or insufficient nucleating agent
- **Cell rupture**: Insufficient melt strength or excessive cooling rate
- **Open-cell structure**: Excessively high foaming temperature or rapid foaming agent escape
Conclusion: Establish Your EPE Foam Quality Assessment System
Evaluating EPE foam quality is not a simple inspection of single metrics, but a systematic assessment process. Based on the data and methods provided in this article, you can:
Establish a three-tier quality control system:
**Tier 1: Rapid Incoming Material Inspection (Completed within 5 minutes)**
1. Visual inspection of color and surface flatness
2. Manual compression test for rebound
3. Tear test to observe cell structure
4. Measurement of three-point density uniformity
**Tier 2: Basic Performance Testing (Laboratory-grade, 30 minutes)**
1. Precise density measurement
2. Rebound rate test (simplified version)
3. Tensile strength test
4. Thickness uniformity check
**Level 3: Comprehensive Performance Evaluation (Third-party or in-house lab)**
1. Full suite of physical property tests
2. Environmental adaptability testing
3. Functional indicator validation
4. Long-term aging tests
Critical Recommendation: Data-Driven Quality Management
Do not rely on “feel” or “experience” to judge EPE foam quality. Establish the following databases:
1. **Supplier Quality Records**: Document test data for each incoming shipment
2. **Production Process Quality Data**: Monitor each production batch if you are a manufacturer
3. **Application Performance Feedback**: Track packaging performance during actual use
4. **Cost-Performance Analysis**: Calculate the actual benefits of different quality grades
The Final Truth: The Balance Between Price and Quality
In the EPE foam industry, price differences typically reflect:
- Density Deviation: A 10% lower price may indicate 3-5 times greater density deviation
- Rebound Rate Variation: A 15% lower price may correspond to an 8-12% lower rebound rate
- Lifespan Discrepancy: A 20% lower price may mean only half the service life
Remember this industry formula:
Actual Usage Cost = Purchase Price / (Quality Factor × Service Life)
Where the quality factor is a function of the composite performance score.
When selecting EPE foam, don't just compare prices per cubic meter—calculate the cost per unit of protective efficacy. While premium EPE foam may have a slightly higher unit price, it can ultimately deliver lower overall costs through superior protection, extended service life, and reduced breakage rates.
The ability to judge quality is your core competitive advantage for controlling costs and ensuring effectiveness in EPE foam procurement and production. Mastering how to interpret these physical performance metrics gives you the authority to evaluate EPE foam quality.

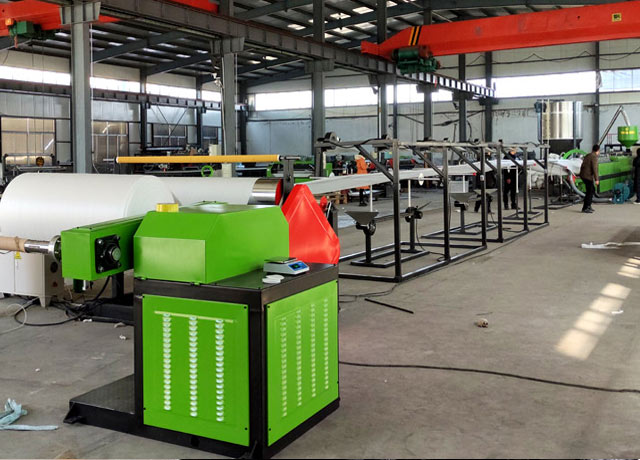
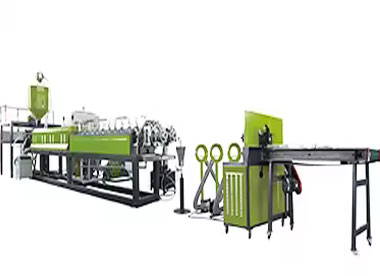
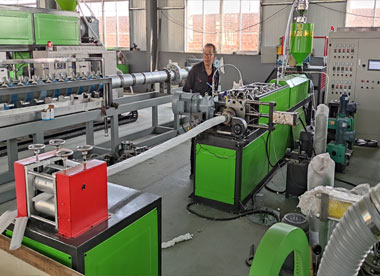
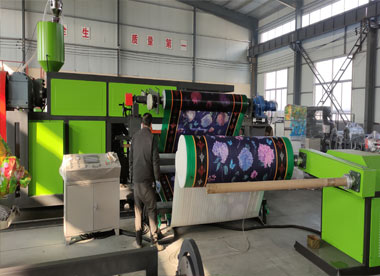
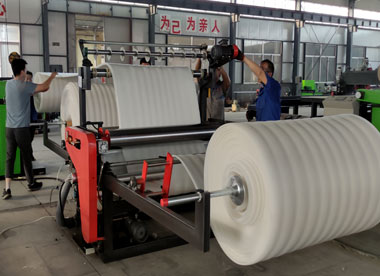
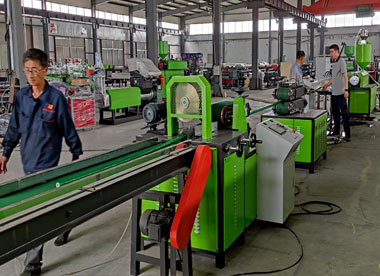
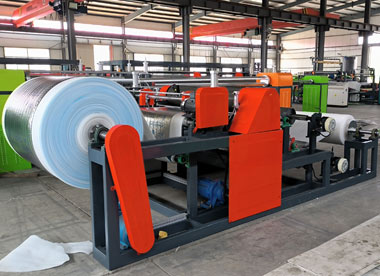
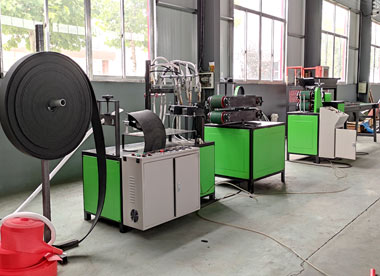
Why Choose Us
China manufacturer of EPE foam machinery since 2003.EPE foam machine not only have covered all over China, but also have exported to more than 70 countries
Would you like to take a closer look at our offer?

You May Like:
We are making In-Depth Analysis of EPE Foam Physical Properties: A Complete Guide from Testing Data to Quality Ass factory, manufacturer & supplier & exporter.We specialize in making EPE foam machine for over 20+ years