The Century-Long Showdown Between EPE Foam and Traditional Packaging Materials
Introduction: The Evolution of Packaging
The evolution of packaging materials chronicles the advancement of materials science, yet it is equally a history of balancing cost, efficiency, and environmental sustainability. From straw and wood shavings to foam plastics, and now to today's EPE foam, each transformation has been profoundly driven by market demands. This article will analyze, through detailed data and real-world case studies, how EPE foam comprehensively surpasses traditional packaging materials across three dimensions: performance, cost, and environmental impact.
Chapter 1: Performance Profiles of Six Major Traditional Packaging Materials
1.1 EPS (Expanded Polystyrene) — The Former Champion
Physical Properties:
Density range: 15–30 kg/m³, rigid structure
Cushioning Principle: Brittle materials absorb energy through fragmentation.
Fatal flaw: Permanently deforms upon impact and cannot be restored. Fragments easily scatter everywhere after breaking and are non-biodegradable, polluting the environment.
Cost Analysis Table:
| Project | EPS | EPE foam |
|---|---|---|
| Raw Material Cost (CNY/cubic meter) | 450–550 | 160–200 |
| Mold Cost (RMB 10,000/set) | 3-5 | 0.15-0.35 |
| Production Efficiency (pieces/hour) | 300-400 | 800-1200 |
| Scrap rate | 8-12% | 3-5% |
1.2 EPP(Expanded Polypropylene) — The Premium Choice
Performance Features:
Excellent resilience: Rebound rate up to 90%
Temperature range:-40℃至130℃
Market Reality: Raw material costs are 2-3 times higher than EPE foam.
1.3 Corrugated cardboard boxes—the most widely chosen option
Strength Data Comparison (BC Corrugated):
| Thickness | Edge Compression Strength(N/m) | EPE foamEquivalent thickness |
|---|---|---|
| 3mm | 4000-5000 | 5mm |
| 5mm | 600-7000 | 8mm |
| 7mm | 8000-9000 | 12mm |
Humidity Test: After 24 hours in a 90% relative humidity environment, corrugated cardboard strength decreased by 60%, while EPE foam strength remained unchanged.。
1.4 Bubble Wrap—The Single-Point Protection Specialist
Limitations of Protection:
Suitable for surface protection, not suitable for structural support
Poor puncture resistance: Can only withstand a puncture force of 5-8 N
Environmental concerns: Difficult to recycle, with a recycling rate below 20%.
1.5 Honeycomb Paperboard—A Heavy-Duty Packaging Solution
Weight Comparison Experiment:
Under equivalent protective performance, honeycomb paperboard weighs 2.2 times more than EPE foam.
Transportation Cost Difference: Based on shipping from Beijing to Guangzhou, EPE foam can reduce freight costs by 35%.
1.6 Traditional Sponge — Specialized Protective Material
Rebound Performance Durability Test:
| Number of compressions | Sponge Rebound Rate | EPE foam Rate |
|---|---|---|
| 100 times | 85% | 98% |
| 1000 times | 65% | 96% |
| 5,000 times | 40% | 94% |
Chapter 2: The Six Overwhelming Advantages of EPE Foam
2.1 Cushioning Performance: A Triumph of Physics
Energy Absorption Curve Analysis:
Low-energy impact (<10J): EPE foam absorbs 85%, EPS absorbs 60%
Medium-energy impact (10-50J): EPE foam exhibits linear response, EPS begins to fragment
High-energy impact (>50J): EPE foam counters through thickness design, EPS fails completely
Laboratory Data:
G-Force (Impact Acceleration) Transmission: EPE foam reduces 25G impacts to below 15G
Multiple Impact Testing: Withstands 3 standard drops at the same location with <5% performance degradation
2.2 Environmental Adaptability: Stability Under Extreme Conditions
Temperature Cycling Test (-40°C to 80°C, 24-hour cycles):
| Material Type | Dimension Change Rate | Hardness variation | Recovery time |
|---|---|---|---|
| EPE foam | ±0.3% | ±5% | Restore immediately |
| EPS | ±1.2% | +25% | 2小时 |
| EPP | ±0.8% | ±8% | 30 minutes |
Humidity Test (RH95%, 72 hours):
EPE foam water absorption rate: <0.01g/cm²
Corrugated paper strength loss: >70%
EPS moisture content increase: 2-3%, affecting thermal insulation performance
2.3 Processing Flexibility: Unlimited Design Possibilities
Cost Comparison of Three Processing Methods:
Cutting & Forming
EPE foam: Direct cutting, no mold cost, precision ±0.5mm
EPS: Requires mold creation, mold cost ¥3,000–¥50,000, lead time 7–15 days
Thermal bonding
EPE foam: Flame/hot-air bonding, bond strength 3-5 N/25 mm
Traditional method: Adhesive bonding, cost increase of 0.3-0.5 RMB/m, VOC emissions
Molded forming
EPE foam: Simple mold, cost 800-3000 RMB
EPS: Steel/aluminum mold, cost 20,000-100,000 RMB
Small-batch production cost analysis:
Order volume <1000 units: EPE foam cost advantage reaches 40-60%
Order volume 1000-5000 units: EPE foam advantage 20-30%
Order volume >10000 units: EPS begins to demonstrate economies of scale
2.4 Weight Advantage: Revolutionizing Logistics Costs
E-commerce Packaging Case Study:
Product: Home appliance, weight 5kg, dimensions 40×30×20cm
Packaging Solution | Packaging weight | Packaging Volume | Annual Logistics Costs (Ten Thousand Units) |
|---|---|---|---|
| EPE foam+ Color box | 280g | Increase by 15% | 18.5 ten thousand yuan |
| EPS+ Color box | 450g | Increase by 25% | 26.3 ten thousand yuan |
Corrugated Paper Full Wrap | 620g | Increase by 40% | 31.8 ten thousand yuan |
Transportation Industry Calculation Formula:
For every 1kg reduction in packaging weight over a 1000km transport distance:
Road transport fuel cost savings: ¥0.15–0.20
Air transport cost savings: ¥3–5
Cross-border e-commerce cost savings: ¥8–12 (including fuel surcharge)
2.5 Environmental Performance: Full Life Cycle Analysis
LCA (Life Cycle Assessment) Comparison of Four Materials:
Energy Consumption (MJ/kg Product)
EPE foam: 85–95
EPS: 110–130
Corrugated cardboard: 60–70 (but increased transport weight must be considered)
EPP: 140–160
Carbon Footprint (kg CO₂/kg product)
EPE foam: 2.8-3.2
EPS: 4.1-4.8
Corrugated cardboard: 1.2-1.5 (but actual usage is 1.8-2 times that of EPE foam)
Recycling Rate
EPE foam: Unlimited physical recycling cycles
EPS: Recyclable only 1-2 times, then downgraded for use
Corrugated cardboard: Recyclable 5-8 times, but fibers shorten with each recycling cycle
Waste Disposal
EPE foam landfill: Begins degradation after 50-80 years
EPS landfill: Non-degradable for over 500 years
Corrugated cardboard landfill: Degrades in 2-4 months but produces methane|
2.6 Total Cost: More Than Just Purchase Price
Total Cost of Ownership (TCO) Model:
Taking the packaging of one million electronic products per year as an example:
Cost item | EPE foam Solution | EPS Solution | Difference Analysis |
|---|---|---|---|
Material costs | ¥650,000 | 580,000 yuan | EPS 10.8% cheaper |
Mold amortization | 30,000 yuan | 240,000 yuan | EPE foam saves 87.5% |
Warehousing Fees | 80,000 yuan | 120,000 yuan | Volume reduced by 33% |
Logistics costs | 320,000 yuan | 120,000 yuan | Weight reduced by 29% |
Damage Compensation | 50,000 yuan | 180,000 yuan | Enhanced protective performance |
Environmental treatment | 20,000 yuan | 80,000 yuan | Recycling Price Difference |
Annual Total Cost | 1.15 million yuan | 1.65 million yuan | EPE foam节省30.3% |
Chapter 3: Empirical Analysis of Five Major Industry Applications
3.1 Electronics Industry: Apple Supply Chain Selection
2015 Turning Point: Apple fully phased out EPS and switched to EPE foam systems
Technical Specifications:
Anti-static requirements: Surface resistance 10⁶-10⁹Ω
Cleanliness requirements: Cleanroom production with particulate control
Traceability: Each material batch traceable to raw material source
Performance Metrics:
Packaging damage rate: Reduced from 0.8% to 0.15%
Warehouse space: Decreased by 40%
Unboxing Experience: Net Promoter Score (NPS) increased by 12 points
3.2 Automotive Components: BMW's Packaging Revolution
Zero-Damage Logistics Standard:
Requirements: Zero scratches, zero deformation during transport
EPE Foam Solution: Customized cavity design
Cost Comparison: 25% reduction vs. traditional packaging; damage rate decreased from 1.2% to 0.3%
3.3 Cold Chain Logistics: Temperature Control Assurance for Biopharmaceuticals
2-8°C Vaccine Transport Test:
EPE foam + Phase Change Material: 72-hour insulation, ±1.5°C temperature fluctuation
EPS Solution: 48-hour insulation, ±3°C temperature fluctuation
Cost Analysis: 15% higher cost per unit volume, but 200% higher reliability
3.4 Furniture Industry: IKEA's Lightweighting Strategy
Flat-Pack Packaging Revolution:
Traditional packaging: 10% furniture weight; EPE foam packaging: 3-4% furniture weight
Global Shipping Savings: Annual fuel reduction of 150,000 tons
Customer Satisfaction: 65% reduction in installation damage complaints
3.5 E-commerce Logistics: Cainiao Network's Green Initiatives
2022 Data:
EPE foam adoption replacing bubble wrap: 38% completion rate
Per-package weight reduction: Average 85g
Annual carbon reduction: Equivalent to planting 1.8 million trees
Damage rate change: Decreased by 0.5 percentage points
Chapter 4: EPE Foam Technology Evolution Path
4.1 Density Gradient Technology
Next-generation EPE foam:
Variable density across different zones within the same material
Application example: Laptop packaging—30kg/m³ at corners, 20kg/m³ at center
Results: 15% weight reduction, 20% enhanced protection
4.2 Smart Composite Technology
Functional composite materials:
EPE foam + PE film: Enhanced surface abrasion resistance
EPE foam + aluminum foil: Improved thermal insulation
EPE foam + non-woven fabric: Increased tear resistance
4.3 Digital Design
Simulation-based packaging optimization:
Finite element analysis predicts cushioning performance
Topology optimization achieves minimal material usage
Actual results: 20-30% reduced material consumption with unchanged performance
Chapter 5: Mathematical Calculation of Return on Investment
5.1 Investment Model for Small Processing Plants
Initial Investment (RMB 500,000 level):
Foaming Unit: RMB 250,000
Cutting Equipment: RMB 80,000
Heat Sealing Equipment: RMB 50,000
Working Capital: RMB 120,000
Profitability Analysis:
Monthly Capacity: 30 tons of EPE foam products
Gross Margin: 25-35%
Payback Period: 14-18 months
Annual Profit Margin: 20-25%
5.2 Comparison with Traditional Material Processing
Indicator | EPE Foam Processing | EPS Molding | Carton Production |
|---|---|---|---|
Equipment Investment | 1X | 2-3X | 1.5-2X |
Energy consumption costs | 0.8X | 1X | 1.2X |
Labor demand | 0.7X | 1X | 1.5X |
Site Requirements | 1X | 1.2X | 2X |
Environmental protection investment | 0.5X | 2X | 0.3X |
Chapter 6: The Inevitable Choice—The Future Is Here
6.1 Policy Drivers
2025 Target: 85% of e-commerce parcels to achieve zero secondary packaging
Plastic Restrictions Upgraded: EPS products restricted in multiple cities
Carbon Tariff Impact: Increased export costs for high-carbon-footprint materials
6.2 Technological Convergence Trends
Material Performance: EPE foam performance parameters improve by 3-5% annually
Processing Technology: Digitalization and automation lower processing barriers
Recycling System: EPE foam recycling supply chain progressively matures
6.3 Market Choice Data
2023 Market Research:
EPE foam share in new procurement decisions: 62%
EPS Replacement Rate: Increases by 8-10% Annually
Customer Satisfaction: EPE Foam Users Score 4.2/5, EPS Users 3.1/5
Conclusion: Not Replacement, but Evolution
EPE foam's advancement beyond traditional packaging materials represents not a simple substitution but a systemic evolution within the packaging industry. This evolution manifests in:
Physical Dimension: From Rigid Protection to Resilient Protection
Economic dimension: From single-purchase cost to total cost of ownership
Environmental dimension: From end-of-pipe treatment to full lifecycle management
Design dimension: From standardized production to personalized customization
Choosing EPE foam fundamentally means embracing more advanced material science, a more economical business model, and a more responsible environmental stance.
For packaging users, this translates to lower overall costs, enhanced product protection, and a greener brand image.
For packaging producers, it means higher technical value-added, more flexible production methods, and a more sustainable business model.
The data speaks for itself:
Replacing 1 ton of EPS with EPE foam reduces carbon emissions by 1.2 tons
Every 1 yuan invested in EPE foam packaging optimization saves 1.5-2 yuan in logistics costs
A 1% increase in EPE foam market penetration creates 8,000–10,000 jobs
This isn't a debate about “which material is better,” but a consideration of “how to build a more efficient, sustainable packaging system.” EPE foam offers the optimal solution at this stage—choosing this solution means choosing the future of the packaging industry.
Final financial facts: If your company's annual packaging expenditure exceeds 1 million yuan, switching to the EPE foam system can save 250,000–350,000 yuan in the first year, followed by 15–25% savings annually thereafter. Behind these figures lies enhanced competitiveness, improved customer satisfaction, and the fulfillment of environmental responsibility.
Choices are never easy, but when the data is clear, the choice becomes simple. The era of EPE foam has arrived—are you ready?
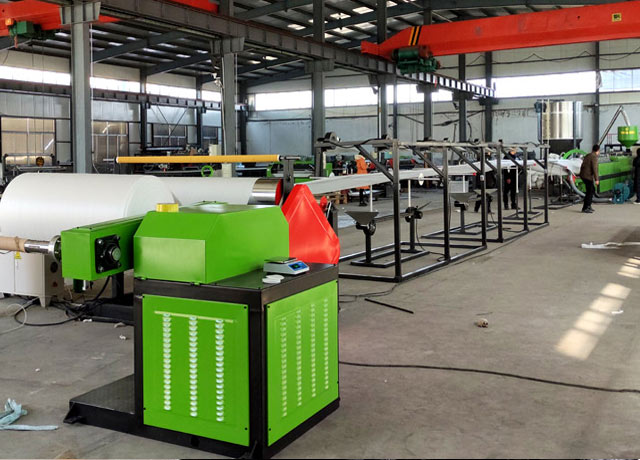
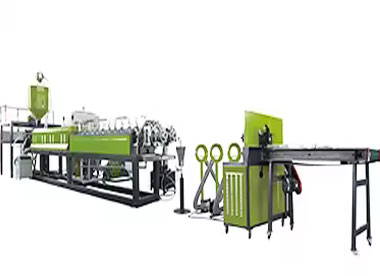
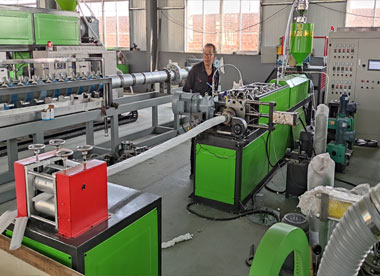
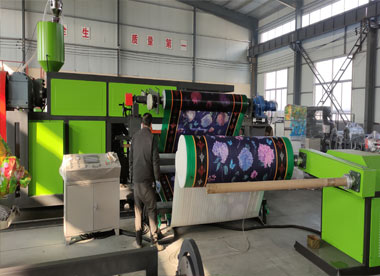
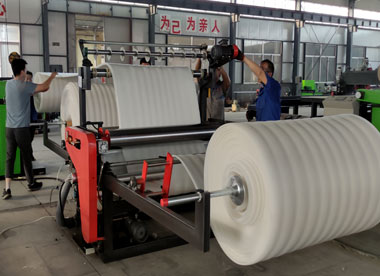
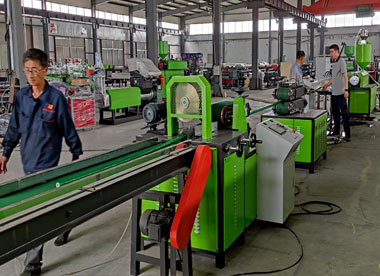
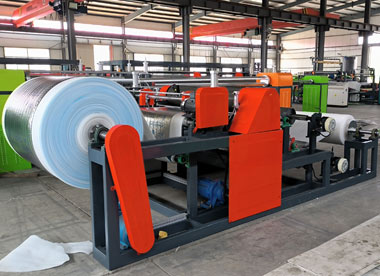
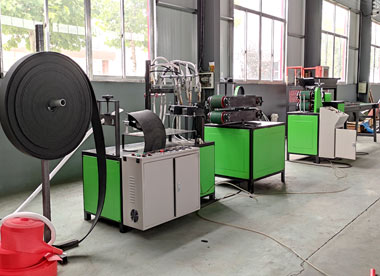
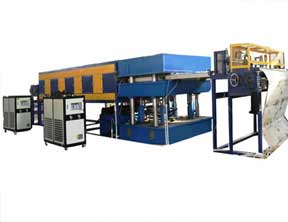
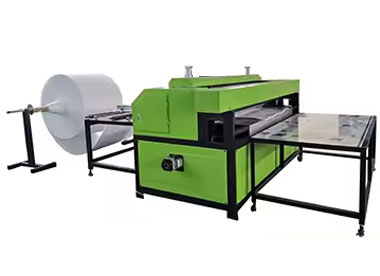
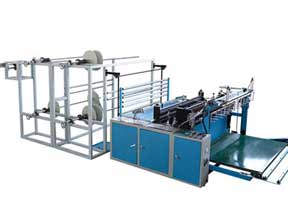
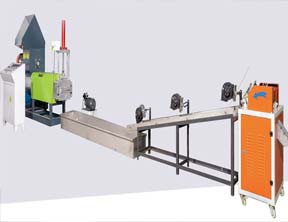
Why Choose Us
China manufacturer of EPE foam machinery since 2003.EPE foam machine not only have covered all over China, but also have exported to more than 70 countries
Would you like to take a closer look at our offer?

You May Like:
We are making The Century-Long Showdown Between EPE Foam and Traditional Packaging Materials factory, manufacturer & supplier & exporter.We specialize in making EPE foam machine for over 20+ years