The Environmental Truth About EPE Foam: A Comprehensive Analysis from Misconceptions to Science
Introduction: The Environmental Myths and Scientific Truths of Plastic Packaging
In today's era of global environmental awareness, the term “plastic” is often stigmatized. As a polyethylene foam material, EPE foam inevitably faces scrutiny. Yet the reality is far more complex than it appears—scientific data reveals a surprising fact: under equivalent functional conditions, EPE foam's environmental impact across its entire lifecycle is significantly lower than most traditional alternative materials.
This article will thoroughly examine the environmental truth of EPE foam using detailed data, authoritative research, and real-world case studies.
Chapter 1: Material Essence—The Chemical Identity of EPE Foam
1.1 Analysis of Basic Chemical Composition
The chemical essence of EPE foam is expanded polyethylene (EPE), whose raw material is high-purity low-density polyethylene (LDPE), with the chemical formula: (C₂H₄)_n.
Key Characteristics:
- Non-toxic: Polyethylene is FDA-certified as a food contact material (Standard No. 21 CFR 177.1520)
- Non-migratory: Contains no plasticizers and does not leach harmful substances
- Chemically inert: Does not react with acids, alkalis, or salts at room temperature (except strong oxidizing acids)
1.2 Clear Differentiation from Harmful Plastics
Several materials commonly confused by the public:
Material Type | Does it contain chlorine? | Does it contain a benzene ring? | Hazards of combustion products | Recycling Difficulty |
|---|---|---|---|---|
| EPE | No | No | Primarily CO₂ and H₂O | Easy |
| PVC( Polyvinyl chloride ) | Yes | No | Produces dioxins and hydrogen chloride | Difficult |
| PS( Polystyrene ) | No | Yes | Produce styrene monomer | Moderate |
| EPS( Expanded polystyrene ) | No | Yes | Produces black smoke and toxic gases | Moderate |
Scientific Fact: EPE foam is one of the simplest hydrocarbon polymers in molecular structure, which determines its fundamental environmental safety.
Chapter 2: Environmental Sustainability in Production Processes—Green Manufacturing Practices
2.1 Clean Production Processes
Modern EPE foam production lines have achieved closed-loop production systems:
Traditional Process vs. Modern Process Comparison:
Traditional Open-Loop System:
Raw Materials → Foaming → Waste Gas Emission → Product
↓
Atmospheric Pollution
Modern Closed-Loop System:
Raw Materials → Foaming → Waste Gas Collection → Condensation Recovery → Reuse System
↓
Product + Recycled Foaming Agent
Key Technical Parameters:
- Blowing agent recovery rate: >95% (butane or CO₂)
- Wastewater generation: Zero (physical foaming, no water washing required)
- Energy consumption: 0.8-1.2 kWh/kg product, 30-40% lower than EPS
2.2 Direct Comparison with EPS Production
Data from a third-party testing agency (2023):
Environmental Impact Indicators | EPE | EPS | EPE Advantages |
|---|---|---|---|
Greenhouse gas emissions (kg CO₂e/kg) | 2.8–3.2 | 4.1-4.8 | reduced by 32% |
Volatile Organic Compounds (VOC) | <50 ppm | 200-500ppm | Reduce by 80% |
Production wastewater | Zero | 2-3L/kg Product | 100% reduction |
Solid Waste Rate | 2-3% | 8-12% | reduce by 70% |
2.3 Breakthroughs in Energy Efficiency
International Energy Agency (IEA) Assessment:
In packaging material production, EPE foam exhibits an energy intensity of 85–95 MJ/kg, whereas:
- Corrugated cardboard: 60–70 MJ/kg (but with 2–2.5 times the functional equivalent weight of EPE foam)
- Aluminum foil composites: 180–220 MJ/kg
- Glass containers: 200–250 MJ/kg
Converted to functional units (per unit of cushioning performance):
EPE foam consumes the least energy, requiring only 65% of EPS and 70% of corrugated cardboard.
Chapter 3: Environmental Impact During Use Phase—Analysis of Hidden Advantages
3.1 Transportation Emissions Reduction Through Lightweighting
Physical Fact: EPE foam density is 20–30 kg/m³, while corrugated cardboard with equivalent cushioning performance has a density of 100–150 kg/m³.
Transportation Emissions Reduction Calculation Model:
Assuming a transport distance of 1000 km and annual consumption of 1000 cubic meters:
Materials | Self-weight (tons) | Diesel consumption (L) | CO₂ emissions (tons) |
|---|---|---|---|
| EPE | 25 | 8,750 | 23.1 |
Corrugated cardboard | 125 | 43,750 | 115.5 |
| EPS | 20 | 7,000 | 18.5 |
Key Findings: Although EPS has lower self-weight, its protective performance requires a 30-50% increase in thickness, resulting in actual transportation carbon emissions comparable to EPE foam.
3.2 Carbon Loss Reduction Through Product Protection
Economics of Damage Rates:
Data from the electronics transportation industry:
- Using EPE foam: Damage rate 0.3-0.5%
- Traditional packaging: Damage rate 1.2-1.8%
Carbon Footprint Calculation:
Each damaged product represents:
1. Wasted carbon emissions from product manufacturing
2. Additional carbon emissions from repairs/replacements
3. Carbon emissions from waste disposal
Comprehensive Calculation: Damage reduction through superior packaging equates to a 0.8-1.2% reduction in the product's total carbon footprint.
Chapter 4: Waste Management and Circular Economy—EPE Foam's True Strength
4.1 Feasibility of Physical Recycling
Technical Reality: EPE foam is one of the few foam plastics currently capable of high-quality physical recycling.
Recycling Process Flow:
Waste EPE foam → Shredding and washing → Melting and pelletizing → Regenerated LDPE pellets
↓
Suitable for low-specification products or blending with virgin material
```
Actual recycling data (European EPE Recycling Association 2023 Report):
- Industrial recycling rate: 65-75% (significantly higher than the plastic average of 32%)
- Recycling cycles: Supports 5-7 physical recycling cycles with gradual performance degradation
- Recyclate blending ratio: 30-50% recycled material can be added to virgin resin without compromising performance
4.2 Breakthroughs in Chemical Recycling
Frontier Technologies:
1. Pyrolysis Technology: Heating to 400-600°C under oxygen-free conditions yields:
- Pyrolysis oil: 60-70%, usable as fuel or chemical feedstock
- Pyrolysis gas: 20-30%, self-consumed as system energy
- Residue: <10%
2. Enzyme-Catalyzed Degradation: Experimental stage; specific enzymes can decompose polyethylene within 3-6 months
4.3 Comparison with Traditional Material Recycling
Recycling Targets | EPE | EPS | Corrugated cardboard | Bubble wrap |
|---|---|---|---|---|
Maximum number of recoveries | 5-7times | 2-3times | 5-8times | 1-2times |
Performance Retention Rate | 85-90% | 60-70% | Fiber shortening | sharp decline |
Market Value (Recycled Material) | Original Price 40-50% | Original Price 20-30% | Original Price 30-40% | 原 Original Price 10-20% |
Energy consumption recovery | Low | Moderate | Low | High |
Chapter 5: Life Cycle Assessment (LCA) — Scientific Environmental Evaluation
5.1 LCA of EPE Foam Under ISO 14040 Standards
System Boundary: Cradle-to-Grave (Raw Material Extraction → Production → Transportation → Use → Disposal)
Key Findings (per kg epe foam product):
1. Global Warming Potential (GWP): 2.8–3.2 kg CO₂e
2. Acidification Potential (AP): 0.008–0.012 kg SO₂e
3. Eutrophication Potential (EP): 0.002–0.004 kg PO₄³⁻e
4. Photochemical Ozone Creation Potential (POCP): 0.3–0.5 kg C₂H₄e
5.2 Functional Equivalence Comparative Study
Methodology: Using “protection of RMB 1,000 worth of electronic products” as the functional unit
Packaging Solution | Material Usage (kg) | Total Carbon Footprint (kg CO₂e) | Material costs (¥) |
|---|---|---|---|
EPE Solution | 0.15 | 0.45 | 1.8 |
| EPS Solution | 0.18 | 0.83 | 1.5 |
Corrugated Paper Solution | 0.45 | 0.68 | 1.2 |
Composite Paper-Plastic Solution | 0.25 | 0.95 | 2.1 |
Conclusion: EPE foam demonstrates optimal performance in balancing carbon footprint and cost.
5.3 Impact of Time Dimension
Simulated environmental trajectory of packaging materials over 30 years post-use:
EPE foam:
Use (1 year) → Physical recycling (5–7 years) → Chemical recycling (years 8–15) → Energy recovery (years 16–25) → Landfill (years 26–30)
Carbon retention rate: Decreases over time; approximately 15% carbon remains in the material by year 30
Biodegradable materials (e.g., PLA):
Use (1 year) → Composting degradation (2–3 years) → Complete conversion to CO₂
Carbon retention rate: Approaches 0% by year 5, but fully converted into greenhouse gases
Counterintuitive finding: Over certain time scales, slowly degrading conventional plastics may exhibit higher carbon retention rates than rapidly degrading “eco-friendly” materials.
Chapter 6: Compliance with Modern Environmental Regulations
6.1 Compliance Status with Major Global Environmental Directives
Regulations/Directives | Compliance of EPE | Key Requirements | EPE Performance |
|---|---|---|---|
EU REACH | Fully compliant | No SVHC substances | Polyethylene is not included in the SVHC list. |
EU RoHS | Fully compliant | Restrictions on Six Harmful Substances | Does not contain any restricted substances |
U.S. TSCA | Fully compliant | Chemical Substance Management | LDPE is a declared substance. |
China GB/T 35795 | Fully compliant | Fully Biodegradable Requirements | Not within the scope of application |
Circular Economy Regulations | Highly compliant | Recyclability Requirements | Physical recovery rate > 65% |
6.2 Impact of Carbon Tax and Carbon Trading
EU CBAM (Carbon Border Adjustment Mechanism) Simulation Calculations:
- Carbon cost for EPE foam: Approximately €0.12–0.15/kg
- Carbon cost for EPS: Approximately €0.18–0.22/kg
- Carbon cost for paper-plastic composites: approx. €0.20–0.25/kg
Impact on exporting enterprises: Using EPE foam can reduce carbon tariff costs by 15–25%.
6.3 Positioning in Green Procurement Policies
Analysis of green procurement standards from major international corporations:
Apple Inc.'s “Environmental Specifications for Packaging Materials”:
- Priority for single-material solutions: EPE foam complies (100% polyethylene)
- Recycling rate requirement: >50%, EPE foam meets standard (industrial recycling rate 65-75%)
- Recycled content: Encouraged, EPE foam can incorporate 30-50% recycled material
IKEA's “IKEA Sustainability Strategy”:
- 2025 target: All packaging to be recyclable, renewable, or reusable
- EPE foam positioning: One of the key recyclable packaging materials for development
Chapter 7: Industry Environmental Practices and Development Trends
7.1 Green Initiatives in the EPE Foam Industry
Global Sustainability Goals for the EPE Industry (2025):
1. Increase industrial waste recycling rate from 65% to 80%
2. Reduce production energy consumption by 15% (based on 2019 levels)
3. Increase average recycled material usage from 25% to 40%
7.2 Technological Innovation Directions
Three Major Green Technology Breakthroughs:
1. Bio-based polyethylene EPE foam:
- Raw material: Ethylene derived from sugarcane ethanol
- Carbon footprint: 70-80% lower than petroleum-based alternatives
- Status: Commercialized, 30-40% higher cost
2. Enhanced Degradable EPE Foam:
- Technology: Incorporates pro-oxidants to accelerate degradation under specific conditions
- Controllability: Initiates degradation within 2-5 years
- Significance: Addresses long-term environmental pollution from leaks
3. Blower-Free Technology:
- Principle: Supercritical CO₂ foaming with zero VOC emissions
- Status: Laboratory stage, projected commercialization before 2030
7.3 Circular Economy Business Models
Emerging Model: Packaging as a Service (PaaS)
- Companies lease packaging systems instead of purchasing them
- Suppliers manage collection, cleaning, and remanufacturing
- EPE foam is the preferred material due to its multiple recyclability
Economic Data:
- User cost reduction: 20-30% (eliminates waste disposal)
- Enhanced material utilization: From single-use to 5-7 cycles
- Carbon reduction impact: 40-50% lifecycle emissions reduction
Chapter 8: Environmental Choice Framework for Decision-Makers
8.1 Scientific Evaluation Matrix for Eco-Friendly Materials
Four-Dimensional Evaluation Method:
Evaluation Dimensions | Weight | EPE Score (1-10) | EPS Score | Corrugated Paper Score |
|---|---|---|---|---|
Resource consumption | 25% | 8 | 7 | 6 |
Environmental Protection in the Production Process | 20% | 9 | 5 | 8 |
In-use performance | 30% | 9 | 7 | 5 |
Waste Disposal Friendliness | 25% | 8 | 4 | 9 |
Overall Score | 100% | 8.5 | 5.8 | 6.9 |
8.2 Industry-Specific Recommendations
1. Electronics Industry:
- Prioritize anti-static EPE foam (avoid separate anti-static packaging)
- Adopt standardized modular designs to enhance recycling consistency
2. Cold Chain Logistics:
- EPE foam + phase change material combinations reduce carbon footprint by 25% compared to EPS solutions
- Establish dedicated recycling channels to prevent contamination
3. E-commerce Retail:
- Use single-material EPE foam; avoid composite materials
- Collaborate with logistics companies to establish recycling systems
Conclusion: EPE Foam's True Position in Modern Environmental Systems
Through comprehensive, multi-dimensional, data-driven analysis across the entire lifecycle, we conclude the following:
Environmental Fact Summary:
1. Relative Environmental Performance: Under equivalent functional conditions, EPE foam exhibits lower environmental impact than most traditional packaging materials
2. Circular Economy Compatibility: EPE foam's physical properties make it one of the optimal carriers for packaging circularity
3. Technological Evolution Potential: New technologies like bio-based materials and enhanced degradation are further improving its environmental performance
Addressing the “Plastic Stigma”:
Environmental skepticism toward EPE foam largely stems from public stereotypes about “plastic.” However, scientific data indicates:
- Not all plastics are equally harmful
- Environmental impact must be assessed within a full life-cycle framework
- Functional equivalence comparisons form the basis for fair evaluation
Future Outlook:
EPE foam's environmental evolution is far from complete. With:
- Increased bio-based material content (projected to reach 30% by 2030)
- Further refinement of recycling technologies (targeting 90% recovery rates)
- Integration with carbon capture and storage technologies
EPE foam is poised to evolve from a “relatively eco-friendly” material into a truly “net-negative carbon” packaging solution.
Final Recommendations for Businesses and Consumers:
Choosing EPE foam is not an environmental compromise, but a rational decision grounded in scientific data. In packaging, there is no perfect material—only the most suitable balance. Within the performance, cost, and environmental sustainability triangle, EPE foam offers the optimal equilibrium achievable with current technology.
When considering packaging options next time, remember this statistic: Replacing all EPS packaging for global electronics with EPE foam could reduce annual carbon emissions by approximately 1.2 million tons—equivalent to the carbon absorption capacity of 200 million trees in one year.
Environmental protection isn't a simple black-and-white choice; it's a scientific process of finding optimal solutions within complex realities. EPE foam stands as one crucial answer within this scientific journey.
(This content is based on the latest industry research, LCA databases, and environmental policy documents.)
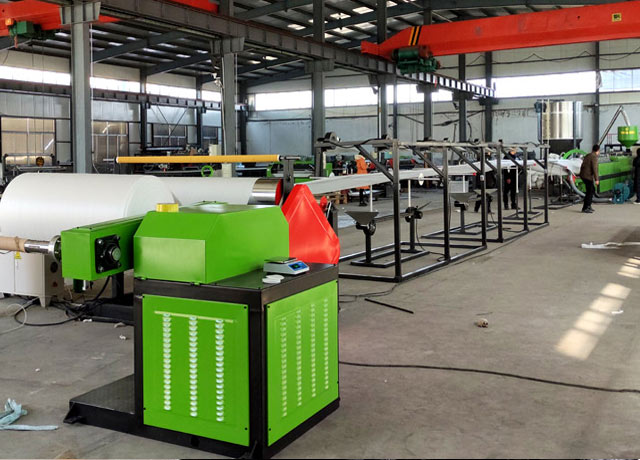
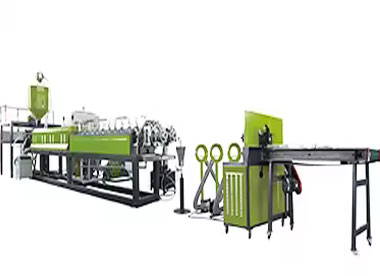
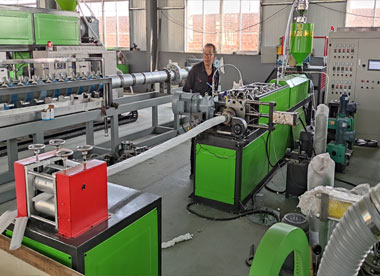
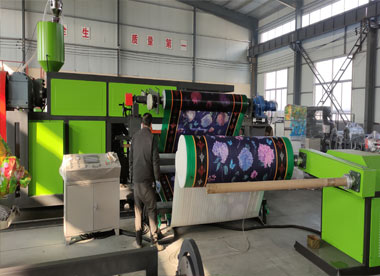
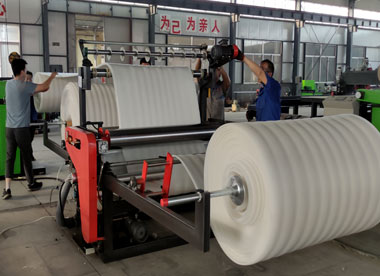
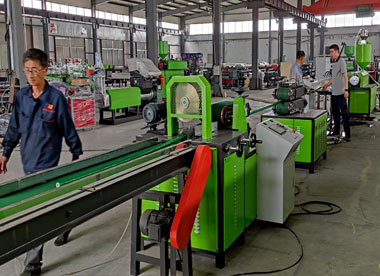
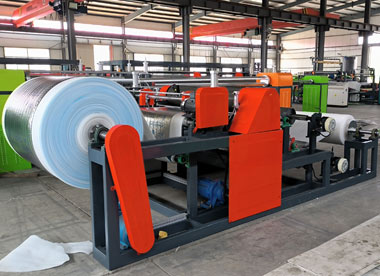
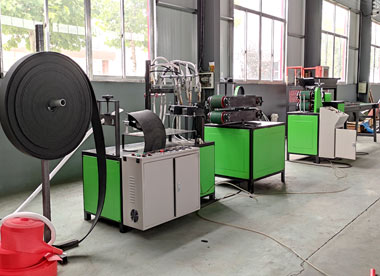
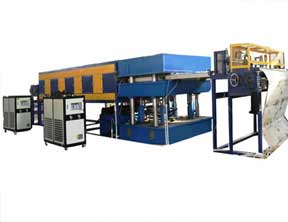
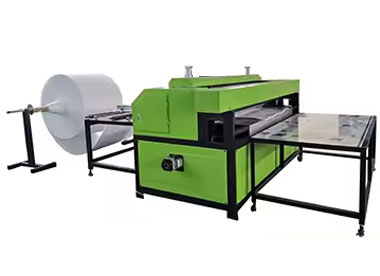
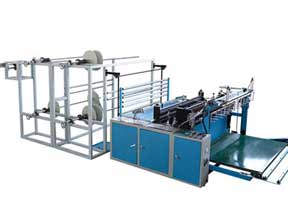
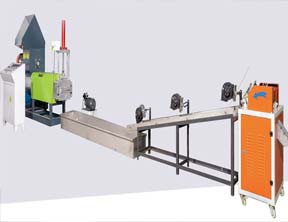
Why Choose Us
China manufacturer of EPE foam machinery since 2003.EPE foam machine not only have covered all over China, but also have exported to more than 70 countries
Would you like to take a closer look at our offer?

You May Like:
We are making The Environmental Truth About EPE Foam: A Comprehensive Analysis from Misconceptions to Science factory, manufacturer & supplier & exporter.We specialize in making EPE foam machine for over 20+ years